Collision Theory
- For a reaction to occur, particle collide with each other with sufficient energy and in the correct geometry orientation
- The minimum amount of energy required to activate a reaction is known as the activation energy.
Factors Affecting Reaction Rate
Temperature
- Rate of reaction increases as temperature increases
- An increase in temperature increases particles' kinetic energy since they are proportional, allowing atoms to maintain a larger speed that increases collision frequency.
- Note: changing temperature does not decrease or increase activation energy of a chemical reaction

Figure 4: The impact of increasing temperature on the rate of a chemical reaction
Surface area
- Increasing surface area increases reaction rate.
- Making a solid more finely divided increases the surface area and therefore the number of particles exposed at the surface.


Figure 2: The impact of surface area on the rate of a chemical reaction
Pressure
- Increasing pressure increases the rate of reaction.
- This is because as the pressure is increased, the collision frequency increases, so rate increases.

Figure 3: The impact of pressure on the rate of a chemical reaction
Concentration
- Increasing the concentration of reactants increases the rate of reaction.
- This is because as concentration increases, the frequency of collisions between reactant particles increases as there are more atoms per unit volume.


Figure 4: The impact of increasing concentration on the rate of a chemical reaction
Catalysis
- The usage of catalysis increases reaction rate
- This is because catalyst lowers activation energy, providing an alternate path that allows more molecules to reach its sufficient energy.
- Note: catalyst does change not enthalpy (∆H) of a reaction, and it is not used up in a reaction

Figure 5: Energy profile before and after using catalysis
Boltzmann Maxwell Distribution Curve
- Boltzmann Maxwell distribution curve shows molecular kinetic energies at a particular temperature. It can be seen that there are only a few particles with high energy and only a few with very low energy.

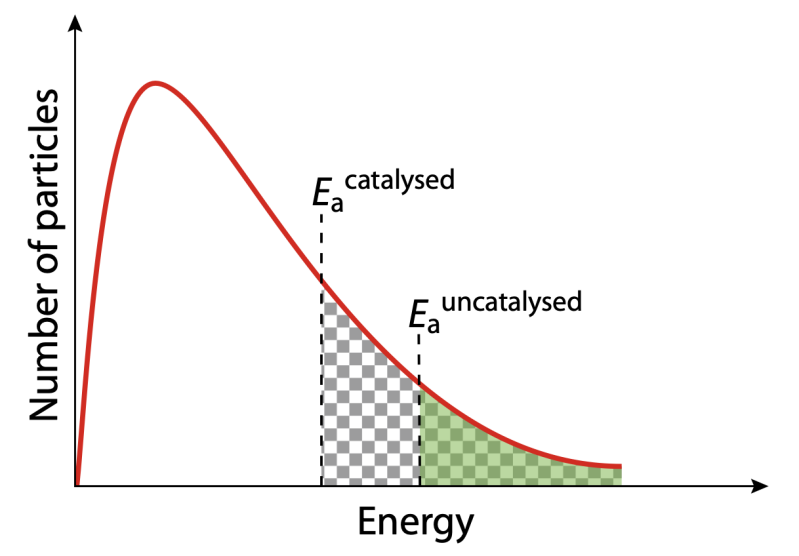
Figure 6: The shaded area represents the number of particles with energy greater than or equal to the activation energy at the lower temperature. The checked area represents the number of particles with energy greater than or equal to the activation energy (Ea) at the higher temperature.
Figure 7: The shaded area represents the number of particles with energy greater than or equal to the activation energy for the un-catalyzed reaction. The checked area represents the number of particles with energy greater than or equal to the activation energy for the catalyzed reaction.
Measuring Rate of Reaction
Change in Mass
- Rate of reaction can be measured by using an electronic balance to measure the change in mass for products or reactants.


Note: This method works for carbon dioxide and oxygen. It does not work for hydrogen gases because they are to light to measure.
Change in Volume
- The volume of gases produced can be measured using a syringe. Gases in the syringe pushing out against the plunger, and this change in volume can be converted to a change in concentration (), and dividing this by the time of the reaction () will yield an average reaction rate.
- Possible limitations
- Some gas is likely to escape before the bung is put on the flask resulting in all values for the volume of carbon dioxide being lower than expected.

Figure 6: Apparatus Set-Up for Measuring Volume Change.

Figure 7: Volume of carbon dioxide versus time
Change in Concentration by Titration
-
In some reactions, it may be possible to measure the conc. of a reactant or product by titrating it against a solution of known concentration.
-
However, since titrating changes the conc. of sol’n, this cannot be done continuously as reactions proceeds. Instead, samples can be removed at given intervals in time & then titrated. But since titration takes time, a technique known as quenching must be used on sample removed
Change in concentration measured using conductivity
- This technique when there is a change in ionic concentrations
-
Can be measured directly with conductivity meter, which involves immersing inert electrodes in the solutions
- See a demo experiment
Non-continuous methods : “clock reactions”
- Sometimes it’s difficult to record continuous change in the rate of a reaction. In these cases, it may be more convenient to measure the time it takes for a reaction to reach a fixed observable point.
- Limitation: can only measure average rate over the time interval